How to Analyze Data in Word using Sally
In Sally, you can perform data analysis using various statistical methods and techniques. Here are some examples of how you can use Sally to analyze data in academic research.
Step 1: Open Data Analyst
Click on the "Data Analyst" button in the menu to open the data analysis agent.
Step 2: Input Data
You can input data in three ways:
- Select the data in Word
- Copy and paste the data from Word
- Import data from Excel or CSV files

Step 4: Analyze Data
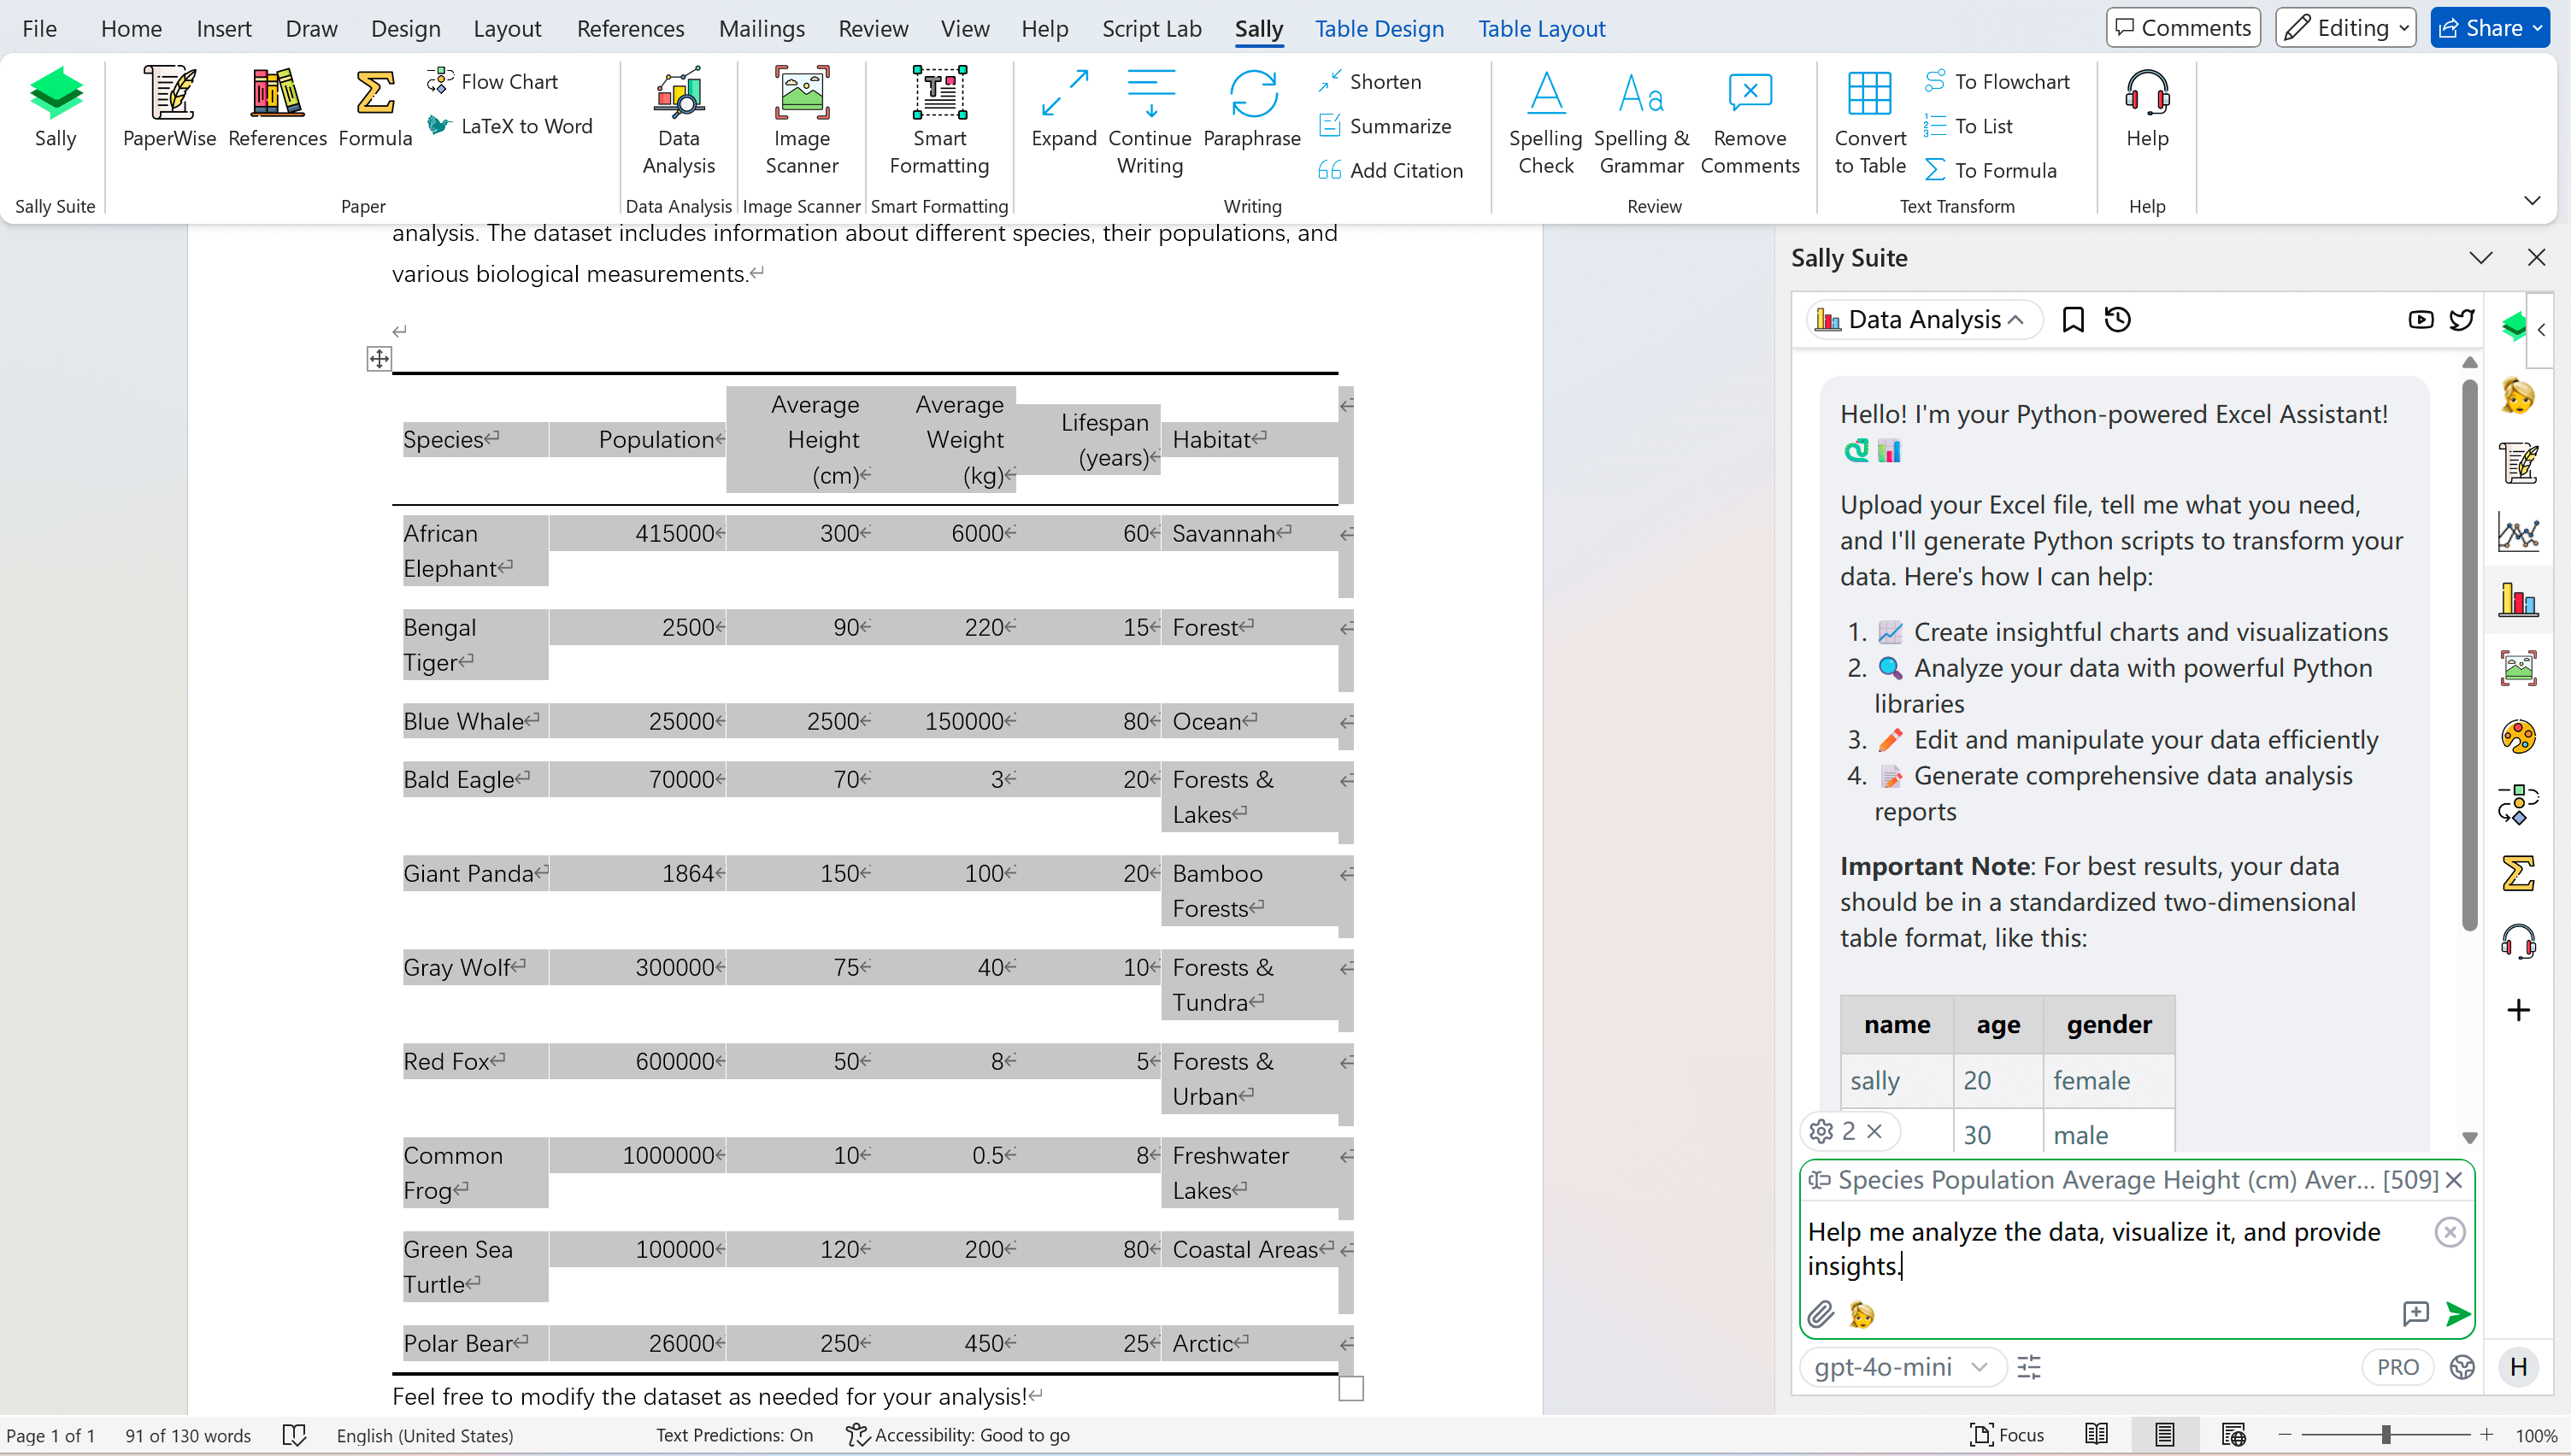
You can ask Data Analyst to analyze the data using various statistical methods and techniques. For example, you can ask Data Analyst to calculate the mean, median, mode, standard deviation, and correlation coefficient of a variable. then Data Analyst will analyze your request and split it into multiple tasks. then generate Python code to perform the analysis and execute it.
Here I ask Data Analyst to Help me analyze the data, visualize it, and provide insights.
Sally can use these Python packages to analyze data:
- NumPy: for numerical computations
- Pandas: for data manipulation and analysis
- Matplotlib: for data visualization
- Seaborn: for statistical data visualization
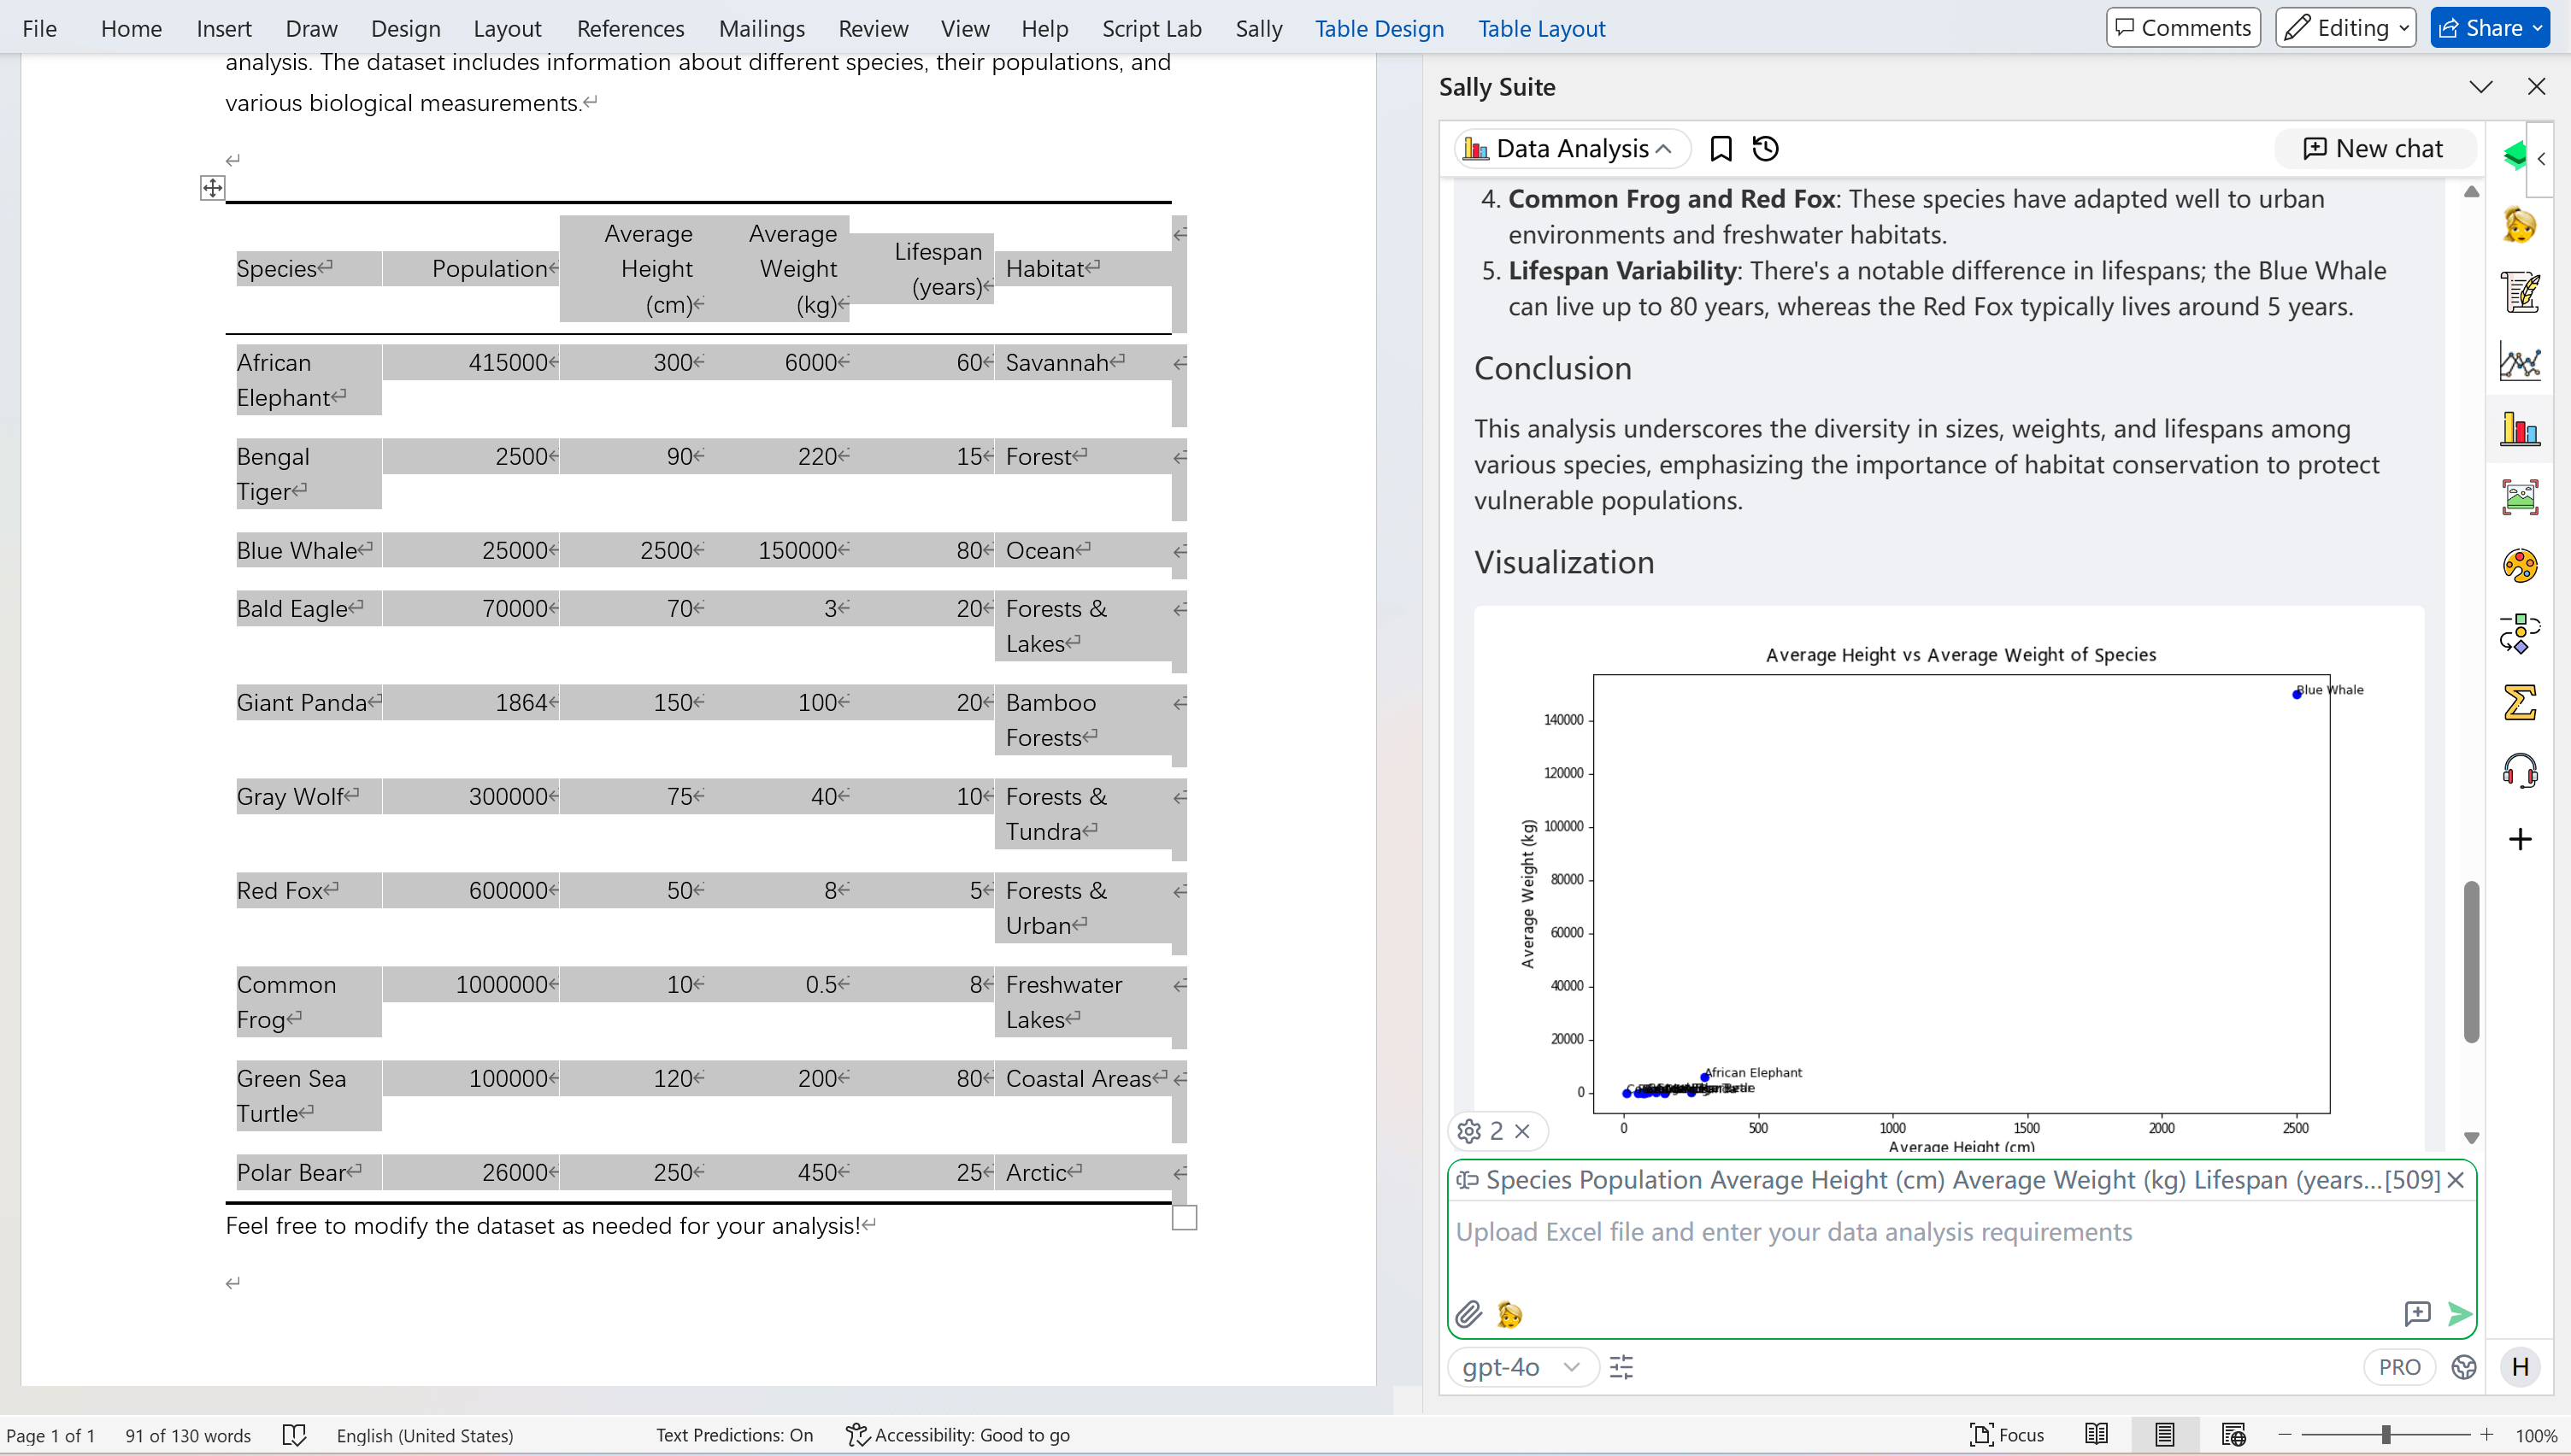
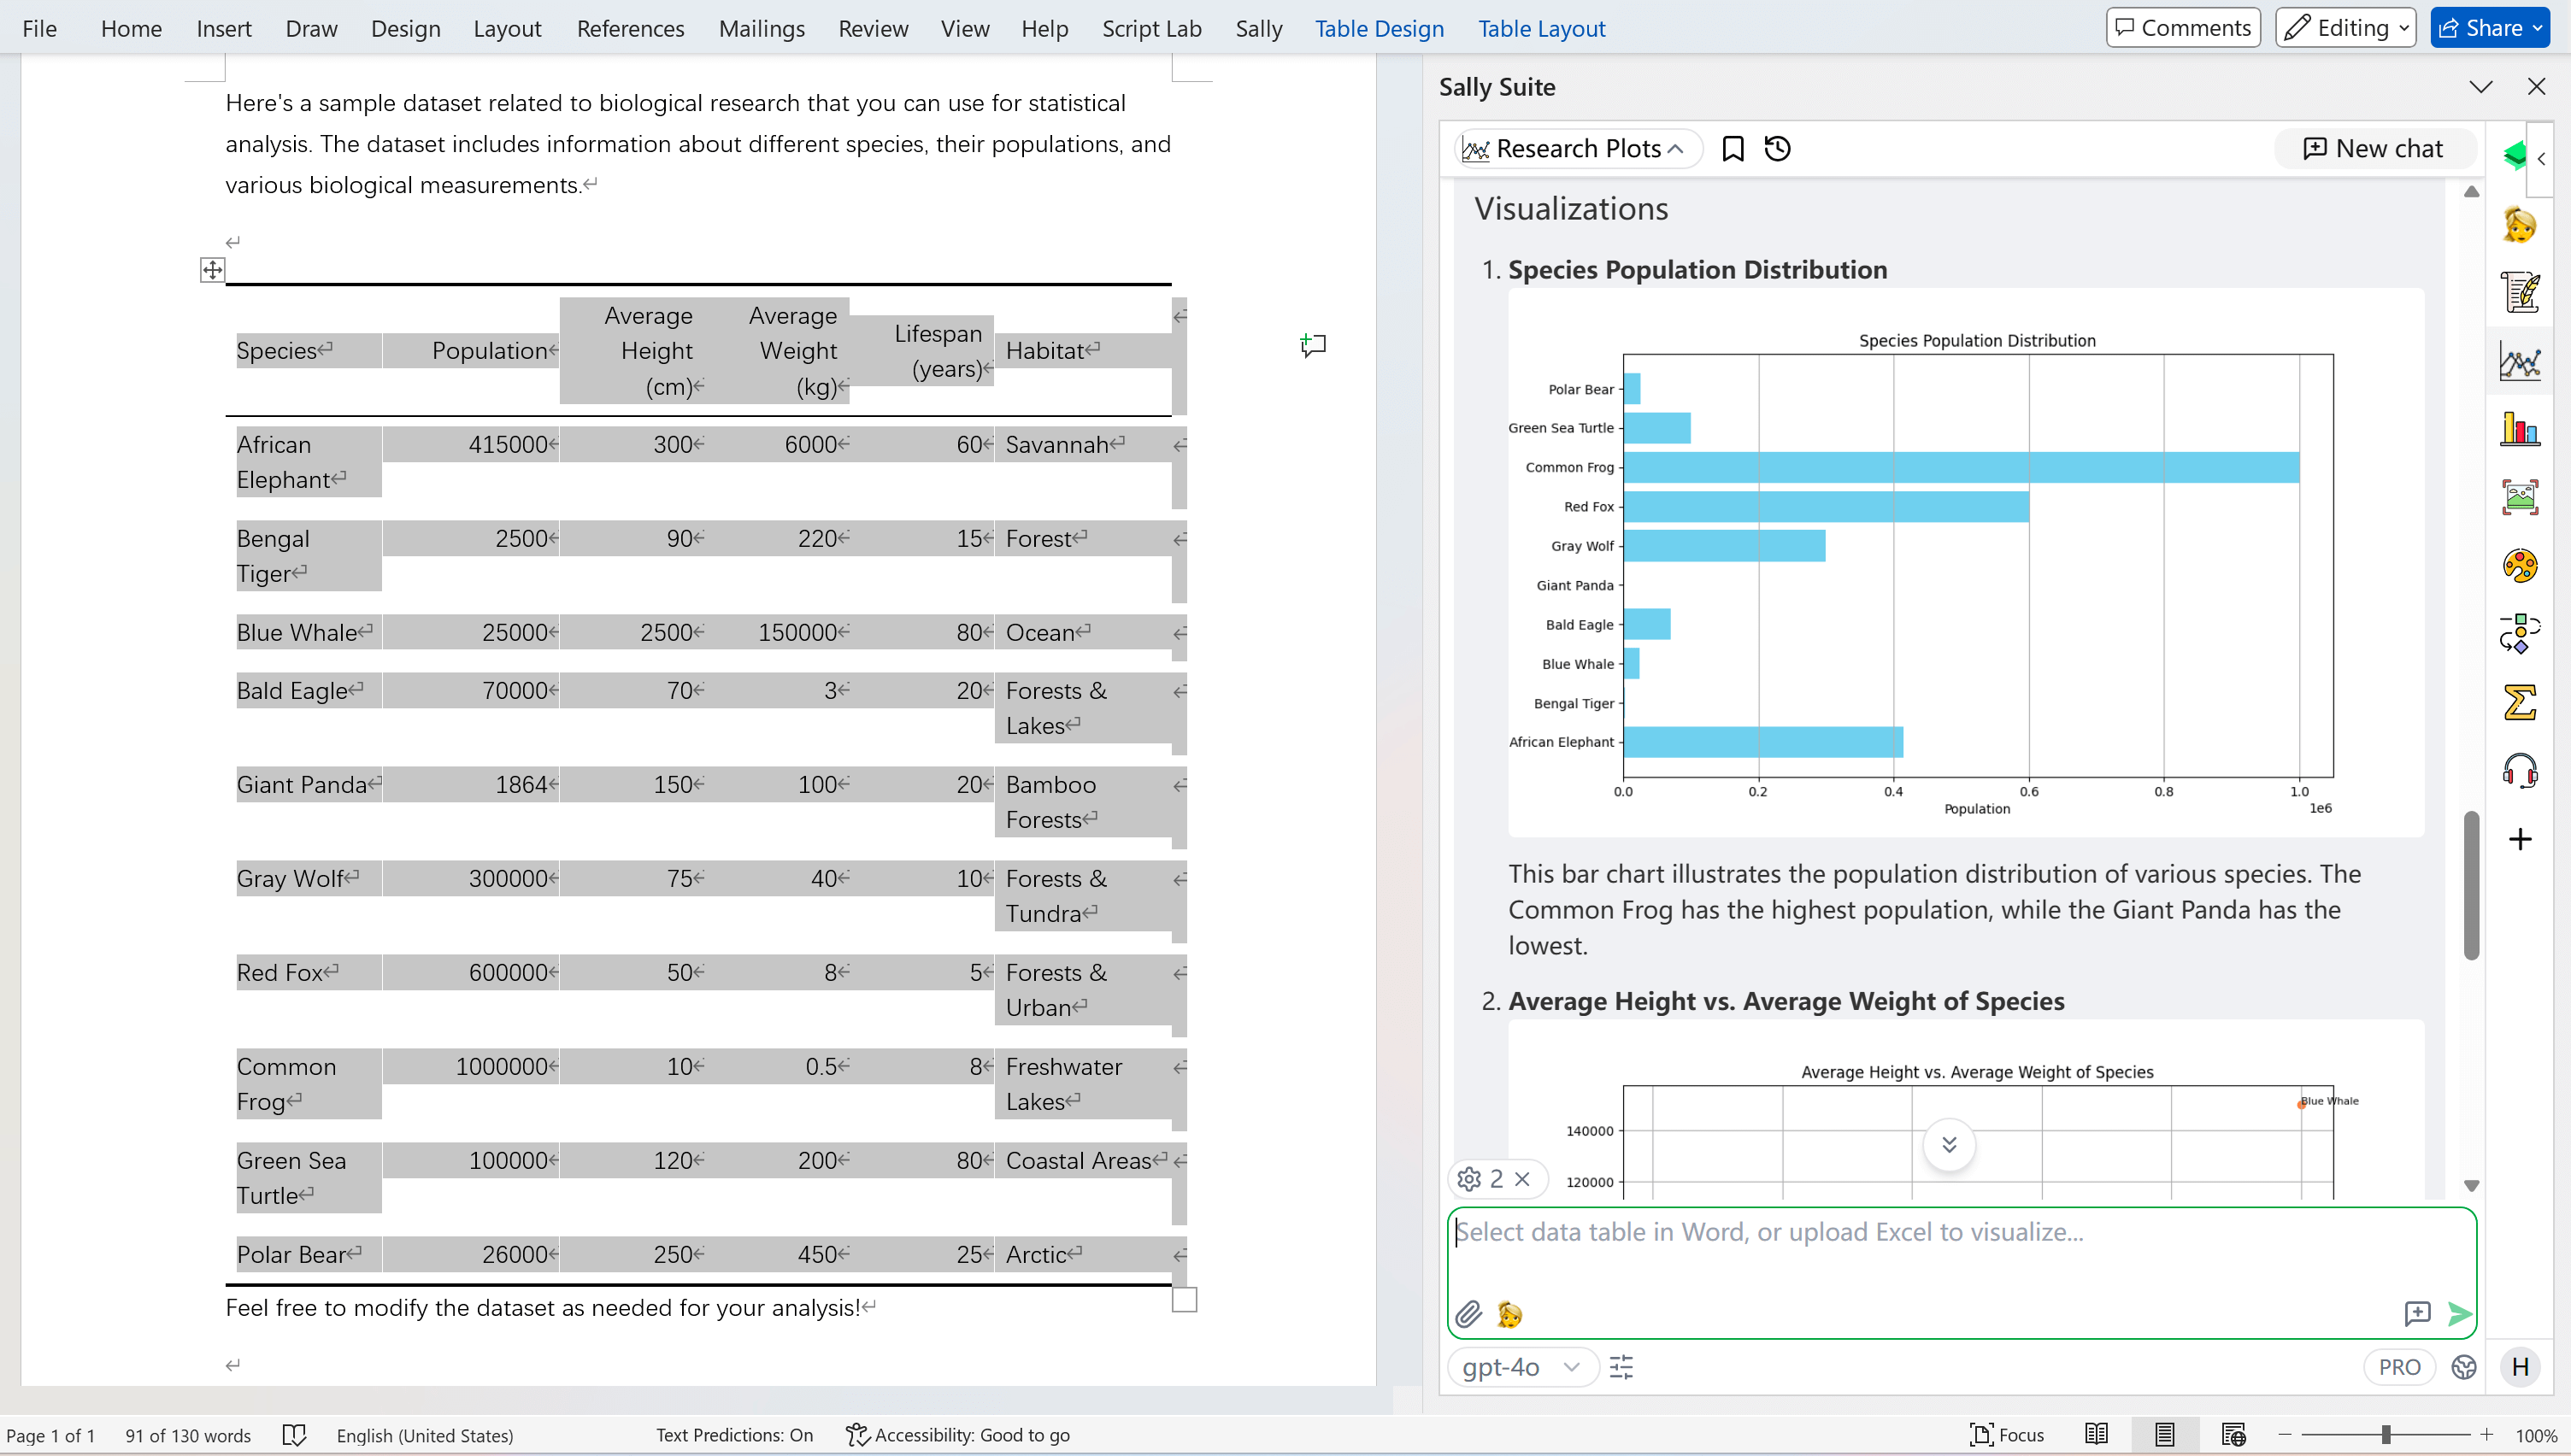
You can visualize the data using various charts and graphs. For example, you can ask Data Analyst to create a bar chart of the mean values of a variable. then Data Analyst will generate Python code to create the chart and execute it.
Conclusion
In this tutorial, you learned how to use Sally to analyze data in academic research. You can input data in three ways, analyze the data using various statistical methods and techniques, visualize the data using various charts and graphs, and interpret the results. Sally can help you save time and effort in data analysis and make your research more efficient and effective.